İnterpolasyon ve Eğri Uydurma

Yazar

Taygun Bulmus

Yayınlanma Tarihi

26 Ağustos 2024

Düzenli takip ettiğiniz bir veriyi, sütun isimleri no - tarih - değer olmak üzere bir dosyaya kaydedin. Örneğin, kilo, günlük telefona bakma saati, uyku saati, yolda geçirdiğiniz süre vs. Bu kısmın sonunda bu veriyi kullanabiliriz.

Amaç: \((n+1)\) adet \(x\) ve \(y\) noktamız olsun. Bu noktaları kullanarak \(y(x)\) analitik fonksiyonu yazabilmek.

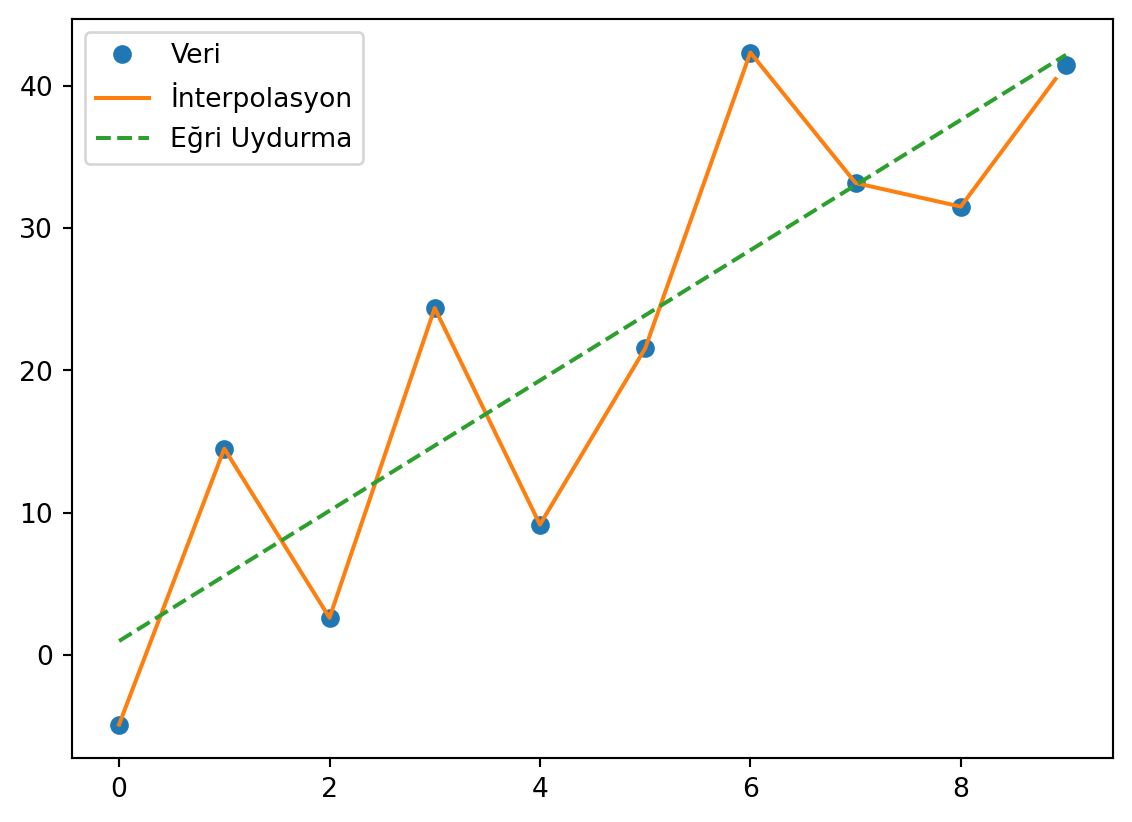
İnterpolasyon: Veri noktalarından geçer.

Eğri Uydurma: Veri noktalarından geçmek zorunda değil.

import numpy as np
import matplotlib.pyplot as plt
from scipy import interpolate
from scipy.optimize import curve_fit

# Veri
x = np.arange(0, 10)
y = 4*x +5 + np.random.randn(len(x))*6

# İnterpolasyon
f_int = interpolate.interp1d(x, y)
xInt = np.arange(0, 9, 0.1)
yInt = f_int(xInt)

# Eğri Uydurma
def func_egri(x, a, b):
    return a*x + b
popt, pcov = curve_fit(func_egri, x, y)

# Çizdirme
plt.close('all')
plt.plot(x, y, 'o', xInt, yInt, '-', x, func_egri(x,*popt), '--')
plt.legend(['Veri', 'İnterpolasyon', 'Eğri Uydurma'], loc='best')
plt.show()